This is my first blog post in a while and it’s mainly due to
2020 being one challenging year on a personal level! Apart from the COVID-19
situation the world is facing, I broke my right foot back in February and I had
to go under the knife in March, and consequently, I was sidelined for three
months and forced to use crutches and wear a boot. So, you can imagine blogging
was not on top of my list of priorities.
This post is about the Geomaps that was newly introduced in
Dashboard 2.0, I was interested to see how the metadata/location tagging side
of things would work in a Planning application and thanks to Oracle, the new
feature did not disappoint.
I will be using the Vision application for my demo and I
will start with the hierarchy, I used Entity dimension (you can use any
dimension which I’m going to show at the end) to create a countries rollup so I
can simply enter some data and see if the dashboard would work.
To understand how do you need to build the metadata for
Geomaps to work, there is a file to download which Oracle has provided with the
full list of countries. You need to use the names exactly as they are shown in
the file for Geomaps to work. You don’t need to create the full list or follow
the hierarchy provided in the file, you just need to make sure you have a
member name or an alias that matches the country name in the file.
To download the file, create a new dashboard 2.0:

Select any data form and drag it to the canvas, change the
view to Geomap and go to chart type properties to download the file.

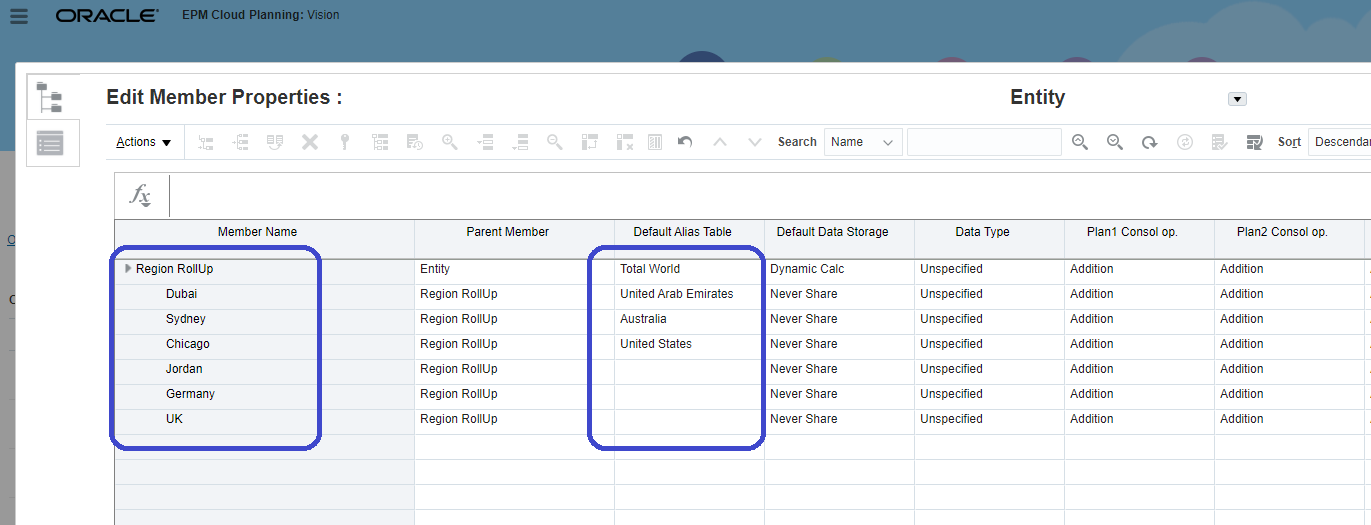
So, based on the file I’m going to create a new rollup in the
Entity dimension (you can use any dimension and I’m going to show that at the
end) and notice that I’m creating a mix of cities and countries as members and assigning
the country name to the city members to see if this would work! Here is the rollup:
Next thing, I will enter some dummy data so I can use the
form in the dashboard.

The last step is to create a dashboard 2.0, select the data
form, and change the chart type to Geomaps.
Here is the dashboard in tabular format and you can see the
data is showing for all countries.
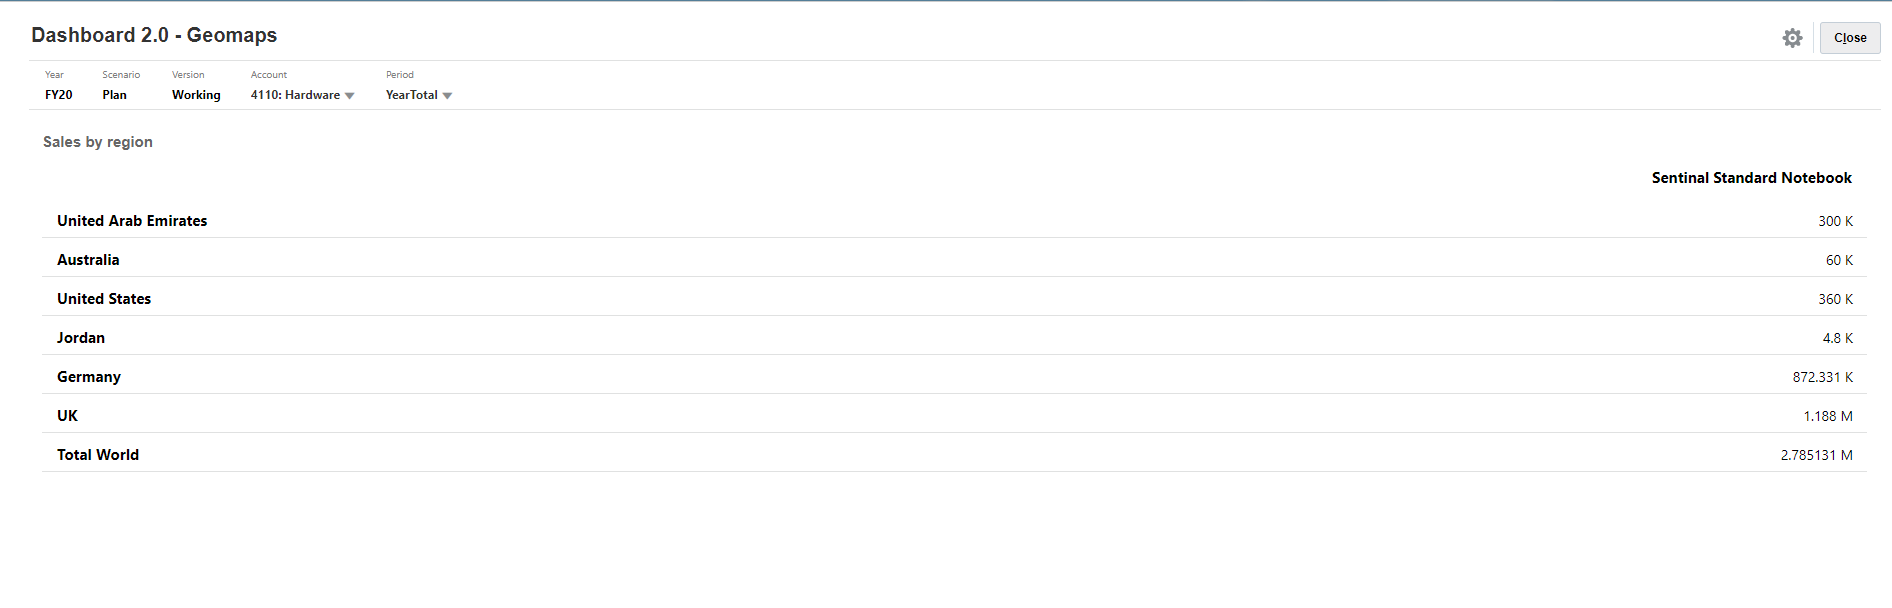
I will change the chart type to Geomaps and see the result

And yes, it is working except for the UK numbers and that is
because the member name is “UK”, not “United Kingdom” as specified in the original
file.

So, to fix this I will simply add an alias to the member.

I will refresh the dashboard and now I can see the UK
numbers.

That is it, it is straight forward and very simple to set up.
Thanks, Oracle!
Before I wrap it up, I want to show that you can use any
dimension, and not just Entity, to store your countries metadata. So, I created
another rollup in the Channel dimension as follows:

And a simple data form to store the data (notice the No Entity member selection).

Finally, here is the dashboard based on the Channel rollup.

As demonstrated, the new geomaps chart type is pretty
powerful and relatively simple to set up, and most importantly, we don’t need
to have any major changes in the application to get it to work.
Is it possible to create geomaps for city’s or county’s in a European country? Eg county’s in Norway?
ReplyDeleteHi Hilma,
DeleteAs of now, you can only create a geo map for countries and US states (World map and United States). By looking at the Geonaps chart's layout settints, I think more maps are coming in the future but I'm not sure when and what exactly.
Tanks for info.
DeleteIn this paper, we have talked about the technological development related to 3D printing. In which we have explained how 3D printing works and how it will affect our lives in the future. As we all know that 3D printing is going to be involved gradually in our everyday life. Therefore, we must bring new ideas about 3D printing for the benefit of society. As seen, 3D printing makes many of our tasks much easier, and we will be able to use it on a smaller scale, even in our homes in future. As we all know that there are always some flaws in technology in the initial stages. However, we are always on the path of making those techniques best by removing those imperfections. If seen, 3D printing is not a new technology, work has been going on for many years. However, the way we are now seeing the possibility. From this it seems that in future it will be used much more. In the coming time, most everyday items will be able to be made according to their requirement in a short time with the help of 3D printing. This will be a technique and a new way of advancement in technology.
ReplyDeleteYou can publish your research and review paper at Multidisciplinary International Journal of Research and Development.
ReplyDelete