Saturday, September 26, 2020

Dashboards 2.0 - Geomaps


This is my first blog post in a while and it’s mainly due to 2020 being one challenging year on a personal level! Apart from the COVID-19 situation the world is facing, I broke my right foot back in February and I had to go under the knife in March, and consequently, I was sidelined for three months and forced to use crutches and wear a boot. So, you can imagine blogging was not on top of my list of priorities.

This post is about the Geomaps that was newly introduced in Dashboard 2.0, I was interested to see how the metadata/location tagging side of things would work in a Planning application and thanks to Oracle, the new feature did not disappoint.

I will be using the Vision application for my demo and I will start with the hierarchy, I used Entity dimension (you can use any dimension which I’m going to show at the end) to create a countries rollup so I can simply enter some data and see if the dashboard would work.

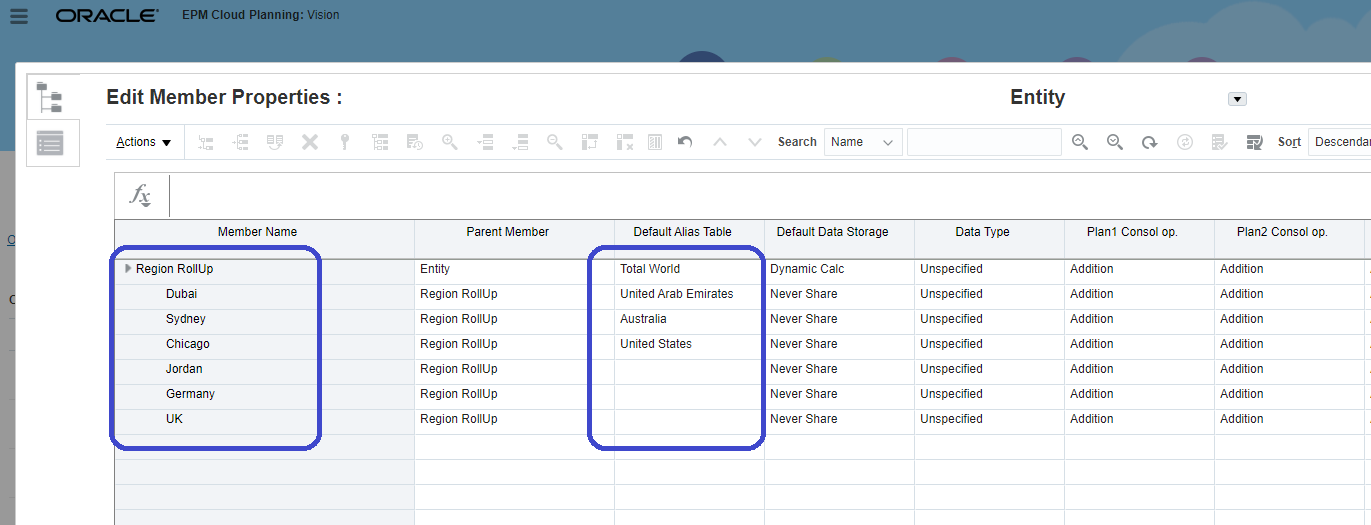
To understand how do you need to build the metadata for Geomaps to work, there is a file to download which Oracle has provided with the full list of countries. You need to use the names exactly as they are shown in the file for Geomaps to work. You don’t need to create the full list or follow the hierarchy provided in the file, you just need to make sure you have a member name or an alias that matches the country name in the file.

To download the file, create a new dashboard 2.0:


Select any data form and drag it to the canvas, change the view to Geomap and go to chart type properties to download the file.


So, based on the file I’m going to create a new rollup in the Entity dimension (you can use any dimension and I’m going to show that at the end) and notice that I’m creating a mix of cities and countries as members and assigning the country name to the city members to see if this would work! Here is the rollup:


Next thing, I will enter some dummy data so I can use the form in the dashboard.


The last step is to create a dashboard 2.0, select the data form, and change the chart type to Geomaps.

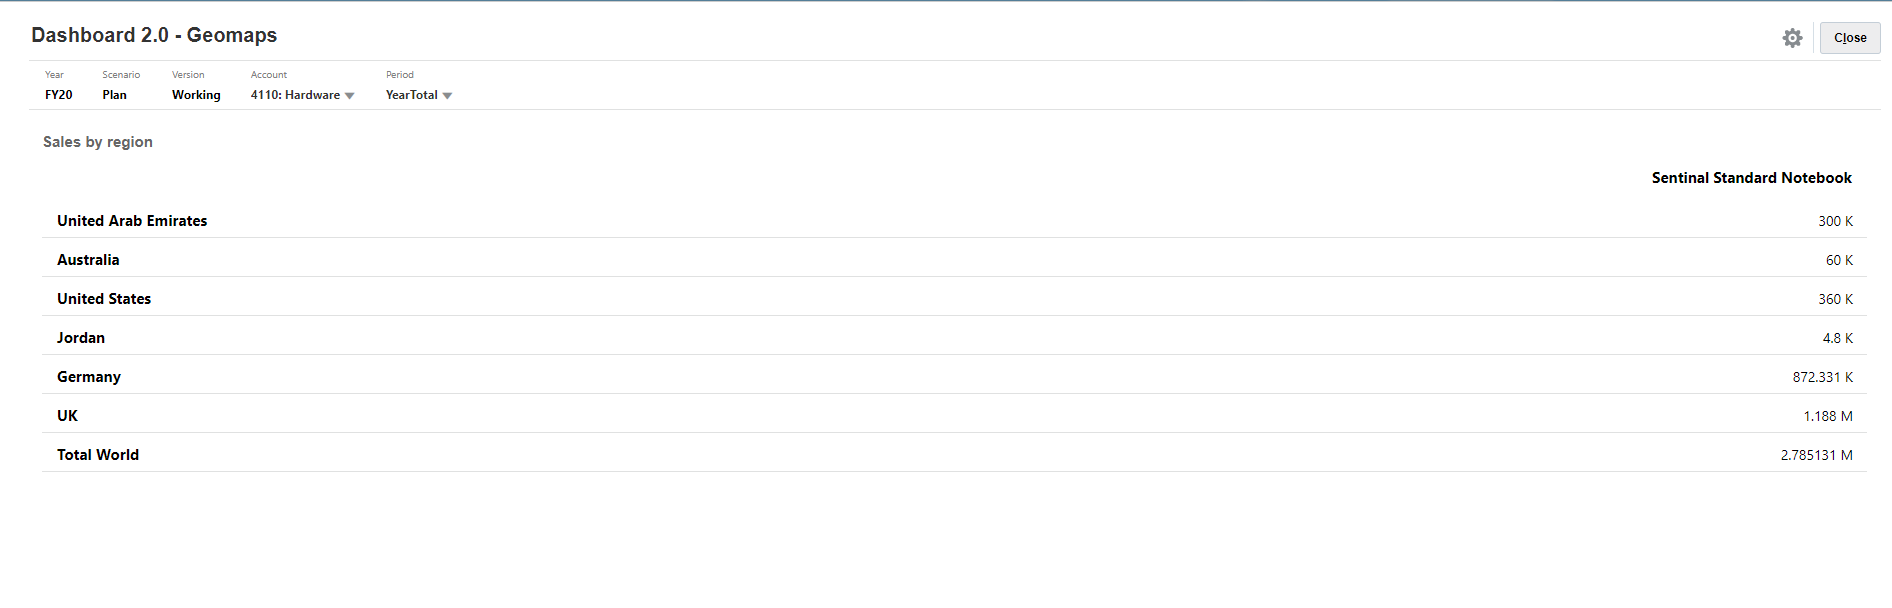
Here is the dashboard in tabular format and you can see the data is showing for all countries.

I will change the chart type to Geomaps and see the result

And yes, it is working except for the UK numbers and that is because the member name is “UK”, not “United Kingdom” as specified in the original file. 


So, to fix this I will simply add an alias to the member.


I will refresh the dashboard and now I can see the UK numbers.


That is it, it is straight forward and very simple to set up. Thanks, Oracle!

Before I wrap it up, I want to show that you can use any dimension, and not just Entity, to store your countries metadata. So, I created another rollup in the Channel dimension as follows:


And a simple data form to store the data (notice the No Entity member selection).


Finally, here is the dashboard based on the Channel rollup.


As demonstrated, the new geomaps chart type is pretty powerful and relatively simple to set up, and most importantly, we don’t need to have any major changes in the application to get it to work.


Thursday, December 5, 2019

Quick tip - Period Mapping Type

I recently bumped into a weird and vague error message while trying to load an ERP custom query in Planning Cloud using the integration feature added in October 2019 release. I'm not going into details of how to setup the integration because it's well documented, so I'll just cover the error in case you run into it.

To summarize the steps, I have:

1. Created BI report using SQL data model with CSV output


2. Created an Enterprise Scheduled job to trigger the same report from ERP's Scheduled Processes


3. Created a Data Source integration application in Data Management


4. Finalized the mapping details in Data Management

All I have to do now is to run the integration! Unfortunately, the data load rule failed at "Import data" stage and I bumped into this error.


FATAL [AIF]: Error in Insert Process Details

The good thing is the ERP extract is getting exported and pushed to EPM without any issues, it's just failing to import in the staging area for some reason. How did I know the extract was working from ERP side? Well I checked the scheduled job output files in ERP and Data Management files in EPM (used EPM Automate) and the extract is there.

Here is the scheduled processes status in ERP indicating the job was successful from ERP side.


The log didn't have any meaningful information apart from FATAL [AIF]: Error in Insert Process Details, only this line so I had to create an SR with Oracle to sort it out and luckily they got back to me with the solution! it was the period mapping type! I'm trying to load the extract in BegBalance & No Year so I was using application level defined periods (not general mapping) and the integration had the "Explicit" Period Mapping Type by default.

After changing it to default it worked just fine.


Sunday, August 25, 2019

Financials Cloud for EPM folks - Value Sets

We all have to work with ERP applications in our EPM implementations one way or another, and I always thought its's beneficial to have some basic understanding and navigation skills in Financials Cloud, it helps when you're troubleshooting metadata issues or data reconciliation etc, so I'm going to start a light weight series on Financials Cloud to cover topics I find helpful when I'm working on a Planning, Profitability or Enterprise Reporting solution.

Before I begin I think it's worth mentioning that CoA structure in Financials is defined in two areas:

1. Value sets - Flat list of values for each segment and their respective properties
2. Hierarchies - Parent/child hierarchy representation for each segment.

In this post I will cover the Chart of Accounts Value Sets, how to navigate and check for specific segment value codes, I will be using a General Accounting Manager role for this. Here is the role name, code and description for reference.


First, we have to navigate to Setup and Maintenance and to do that we have three options.

1- From the landing page (this is the standard theme, you'll probably have a custom defined theme setup but it should be the same).


2- From the Navigator


3. From user settings and actions (click on the username in the top right corner)


Next thing we need to navigate to the setup page for Financials.


Click on Financial Reporting Structures functional area and then click on Manage Chart if Accounts Value Sets


This will take you to the setup page where you have your CoA segments defined, from this page select  General Ledger as your module and hit search to retrieve your CoA segments.


This is the CoA structure in this scenario. Account, Company, Cost Centre, LoB and Product segments.


All you have to do is select one of the segments, click Manage Values and search for your value to retrieve certain information like description or start/end dates (not relevant for EPM). Here you can see the Account segment values and their properties.


And that's it for today.

Monday, May 6, 2019

Artifact Labels - EPBCS Quick Tip

Artifacts Labels is a very powerful and useful feature in PBCS/EPBCS and a lot of folks simply ignore it because they usually work on implementation with one functional language (typically English) and hence no need for labels etc. A typical use case is when you have users in different geographical locations (for example:Australia and Japan) so you need to add Japanese labels alongside the English ones to give the users in Japan an option to view the application in the local language.

But there is also another use case for labels when you have objects(forms, rules etc) with technical prefixes and administrative jargon that do not make any sense to the normal user, so you can use Artifact Labels to give it a meaningful name and that's what I'm going to write about in this blog.

Before we start I'll give you some background, Artifact Labels for Hyperion Planning on-premise folks is the equivalent of  HspCustomMsgs files. Back in on-premise days, we used to generate the custom HspCustomMsgs property files and define the labels using ASCII text as shown below.


Luckily, in the cloud it is much easier and we don't have to access the Planning server, add the files, restart the server...😊

So let's get on with it, here is a list of data forms I want to re-label.


I'll go to Tools -> Artifact Labels and filter for "Form" objects. Notice the default label is grayed out and you cannot edit it. 


I'll add a language "English".


I'll add the labels next to the forms I want to change (objects without English label will display the default label)


Save


Back to the Data card again and now we can see the labeled forms, this looks much better and neater if you ask me! 


Cannot Perform Custom Calc. Essbase Error(1300033) - PCMCS Quick Tip

Another post sitting in my drafts folder for quite some time about an issue I encountered in PCMCS allocation rules, specifically when it comes to using alternate hierarchies.

I was getting the following Essbase issue:

Cannot Perform Custom Calc. Essbase Error(1300033): Upper-level members, for example [General and Administrative], are not allowed in argument [POV]. Select a level-0 member

So let's get on with it and I'll start with the background and how it started using a sample Oracle demo application. When you're building allocation rules in PCMCS you specify three main components that are going to define how your is executed:

1- Source (The data slice you need to allocate)

2- Destination (The allocated data)


3- Driver Basis (How data is allocated)

I'm not going to delve into the basics of PCM rules in this post and I'll assume you have some product knowledge (if you have specific questions please post them in the comments section and I'll try to get back to you ASAP).

In the Source tab, I was trying to allocate a data subset based on alternate hierarchy (my cube deign had thousands of members and I needed an alternate hierarchy to make it more efficient and easier to manage). So here is my alternate hierarchy:


In the allocation rule, I want to allocate General and Administrative, Sales, and Marketing entities (Reminder: I'm using a sample application and in reailty, my cube had a lot more members and dimensions) and here is my Entity dimension selection in Source tab.


But the problem is when I try and run the rule I'm getting the Essbase error.

Cannot Perform Custom Calc. Essbase Error(1300033): Upper-level members, for example [General and Administrative], are not allowed in argument [POV]. Select a level-0 member


This didn't make sense, because I use parent members in the Source definition all the time and I know it works perfectly and to prove it here is the same allocation rule using the primary hierarchy.


And the primary vs alternate hierarchy:


To conclude, you need to use the primary hierarchy! It took me a while to figure it out and hopefully, it'll save some time for anyone facing the same issue.

I still need to figure out why the alternate hierarchy is not working and I'll keep you guys posted as soon as I figure it out.


Friday, May 3, 2019

Enterprise Performance Reporting Tips - Drill to Content

It's been a while since I last wrote a blog, I've had a couple of drafts that needed my attention but thanks to a busy schedule at work and my Ultra Trail Australia 100 training (I'm running it in two weeks) I had to put it on hold. Good thing I'm now tapering and I no longer have to run crazy long runs in the weekends.

Back to the post, I don't know if you've been using Enterprise Performance Reporting's Management Reporting lately, but if you're not then it's time to consider the tool! I will not go in details and describe the pros and cons of the tool compared to Web Reporting Studio, I will only say it has great potential and it's looking great already.

One of the best things about EPRCS is connectivity to different sources of data,  so you can create a data connection to build a report from:

1. Financials Cloud GL
2. EPBCS
3. FCCS
4. PCMCS

And this also means you can combine different grids/data sources in the same report and that's pretty awesome.

In this post, I'm going to write about the Drill to Content feature which can be useful if you have multiple environments and you want to drill back to the source environment from EPRCS.

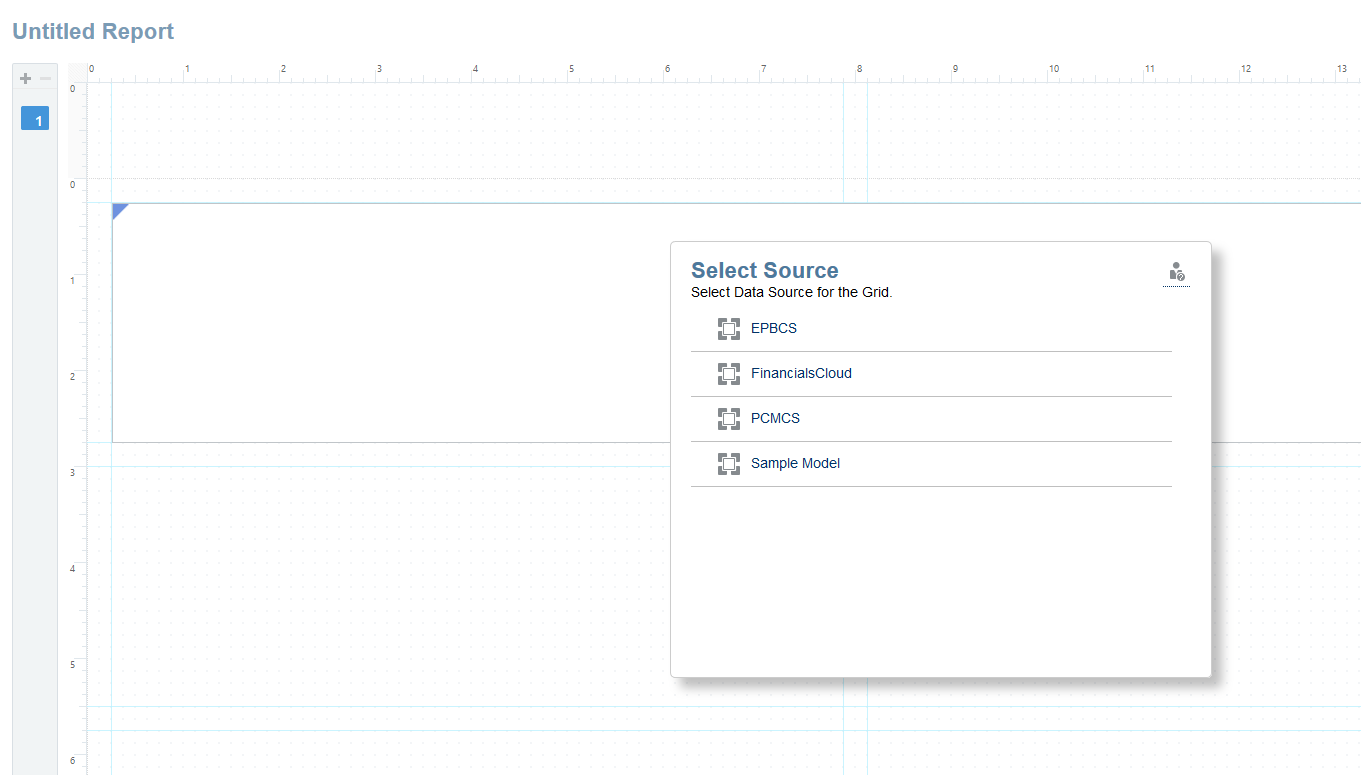
Let's get on with it, here is a list of my data sources.


I'll create a very simple report using EPBCS as a data source.


I'll edit the grid in the report and click on the cell I want the Drill to Content link to appear on, go to "Drill to Content" and add the connection details.


After saving the report you will notice the Drill to Content indicator on the cell.


Click on it and you're taken back to EPBCS.


Very simple and handy at the same time.

Hope this helps.